World trade shows signs of bouncing back from a deep, COVID-19 induced slump, but World Trade Organization economists caution that any recovery could be disrupted by the ongoing pandemic effects.
Main Points
- World merchandise trade volume is forecast to fall 9.2% in 2020.
- The projected decline is less than the 12.9% drop foreseen in the optimistic scenario from the April trade forecast.
- Trade volume growth should rebound to 7.2% in 2021 but will remain well below the pre-crisis trend.
- Global GDP will fall by 4.8% in 2020 before rising by 4.9% in 2021.
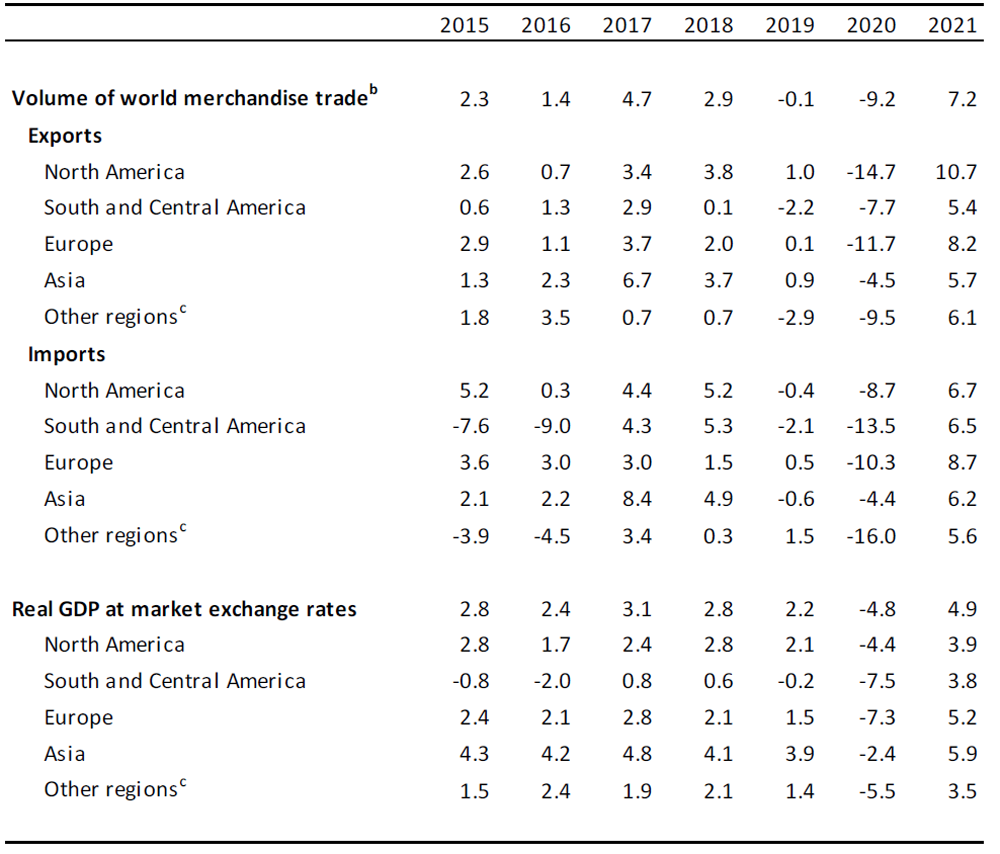
- The trade decline in Asia of 4.5% for exports and 4.4% for imports in 2020 will be smaller than in other regions.
- Downside risks still predominate, particularly if there is resurgence of COVID-19 cases in the coming months.
- The 14.3% quarter-on-quarter decline in world merchandise trade in the second quarter is the largest on record, but high-frequency data point to a partial rebound in the third quarter.
The WTO now forecasts a 9.2% decline in the volume of world merchandise trade for 2020, followed by a 7.2% rise in 2021 (Chart 1). These estimates are subject to an unusually high degree of uncertainty since they depend on the evolution of the pandemic and government responses to it.
Current data suggests a projected decline for the current year that is less severe than the 12.9% drop foreseen under the more optimistic of two scenarios outlined in the WTO’s April trade forecast. Strong trade performance in June and July have brought some signs of optimism for overall trade growth in 2020. Trade growth in COVID-19 related products was particularly strong in these months, showing trade’s ability to help governments obtain needed supplies. Conversely, the forecast for next year is more pessimistic than the previous estimate of 21.3% growth, leaving merchandise trade well below its pre-pandemic trend in 2021 (Chart 1).
The performance of trade for the year to date exceeded expectations due to a surge in June and July as lockdowns were eased and economic activity accelerated. The pace of expansion could slow sharply once pent up demand is exhausted and business inventories have been replenished. More negative outcomes are possible if there is a resurgence of COVID‑19 in the fourth quarter.
In contrast to trade, GDP fell more than expected in the first half of 2020, causing forecasts for the year to be downgraded. Consensus estimates now put the decline in world market-weighted GDP in 2020 at -4.8% compared to ‑2.5% under the more optimistic scenario outlined in the WTO’s April forecast. GDP growth is expected to pick up to 4.9% in 2021, but this is highly dependent on policy measures and on the severity of the disease (Table 1).
Chart 1 – World merchandise trade volume, 2000‑2021
Indices, 2015=100

Source: WTO Secretariat.
Note: Figures for 2020 and 2021 are projections.
As previously noted in the forecast update of 22 June, a weak trade recovery that fails to return trade to the pre-pandemic trend was a distinct possibility. This would result in merchandise trade growth of around 5% next year, rather than 20% in the case of a rapid return to the previous trajectory. The current trade forecast of 7.2% for 2021 appears to be closer to the “weak recovery” scenario than to a “quick return to trend”.
Although the trade decline during the COVID-19 pandemic is similar in magnitude to the global financial crisis of 2008-09, the economic context is very different. The contraction in GDP has been much stronger in the current recession while the fall in trade has been more moderate. As a result, the volume of world merchandise trade is only expected to decline around twice as much as world GDP at market exchange rates, rather than six times as much during the 2009 collapse.
This divergent performance of trade during the COVID-19 outbreak has much to do with the nature of the pandemic and the policies used to combat it. Lockdowns and travel restrictions imposed significant supply-side constraints on national economies, drastically reducing output and employment in sectors that are usually resistant to business cycle fluctuations, particularly non-traded services. At the same time, robust monetary and fiscal policies have propped up incomes, allowing consumption and imports to rebound once lockdowns were eased.
Whether the recovery can be sustained over the medium term will depend on the strength of investment and employment. Both could be undermined if confidence is dented by new outbreaks of COVID-19, which might force governments to impose additional lockdowns. As a result, risks to the forecast are firmly on the downside. There is some limited upside potential if a vaccine or other medical treatments prove to be effective, but their impact would be less immediate.
Ballooning public debt could also weigh on trade and GDP growth over the longer term. Although rich countries are unlikely to face sovereign debt crises as a result of fiscal expansion, poorer ones may find their increased debt burdens extremely onerous. Deficit spending could also influence trade balances, reducing national saving and swelling trade deficits in some countries.
“The incidence of COVID-19 worldwide has fallen from its peak in the spring, but it remains stubbornly high in many areas. Trade has played a critical role in responding to the pandemic, allowing countries to secure access to vital food and medical supplies. Trade has also facilitated new ways of working during the crisis through the provision of traded IT products and services. One of the greatest risks for the global economy in the aftermath of the pandemic would be a descent into protectionism. International cooperation is essential as we move forward, and the WTO is the ideal forum to resolve any outstanding trade issues stemming from the crisis,” Deputy Director-General Yi Xiaozhun said.
Table 1: Merchandise trade volume and real GDP, 2015-2021a
Annual % change
a Figures for 2020 and 2021 are projections.
b Average of exports and imports.
c Other regions comprise Africa, Middle East and Commonwealth of Independent States (CIS), including associate and former member States.
Source: WTO Secretariat for trade, consensus estimates for GDP.
As Table 1 shows, all regions are expected to see big percentage increases in export and import volumes in 2021, but it should be noted that this growth will be off of a reduced base. Thus, even large percentage changes may not translate into better material conditions. For example, imports into Asia and South America are both expected to grow by 6.2% and 6.5% respectively next year, but Asia’s rise would follow on a modest 4.4% decline this year while South America’s would be on top of a steep 13.5% plunge in 2020. In this case Asia’s imports would have substantially recovered while South America’s trade would still be deeply depressed.
Upside And Downside Risks To The Forecast
This box examines some of the risks associated with the forecast and other factors that might be relevant for trade over the medium-to-long term. According to recent estimates, a resurgence of COVID-19 requiring further lockdowns could reduce global GDP growth by 2 to 3 percentage points next year. Other downside risks include an uncertain outlook for fiscal policy and challenging job markets in many countries. Together, these risks could shave up to 4 percentage points off of world merchandise trade growth in 2021.
On the other hand, rapid deployment of an effective vaccine could boost confidence and raise output growth by 1 to 2 percentage points in 2021. This would add up to 3 percentage points to the pace of trade expansion. Other factors could contribute to better trade outcomes, including wealth effects from strong real estate and stock markets, and a growth boost from new technology sectors such as artificial intelligence and e-commerce. The pandemic has also stimulated innovation in traditional business sectors, which have leveraged information technology to deliver goods and services to customers at home.
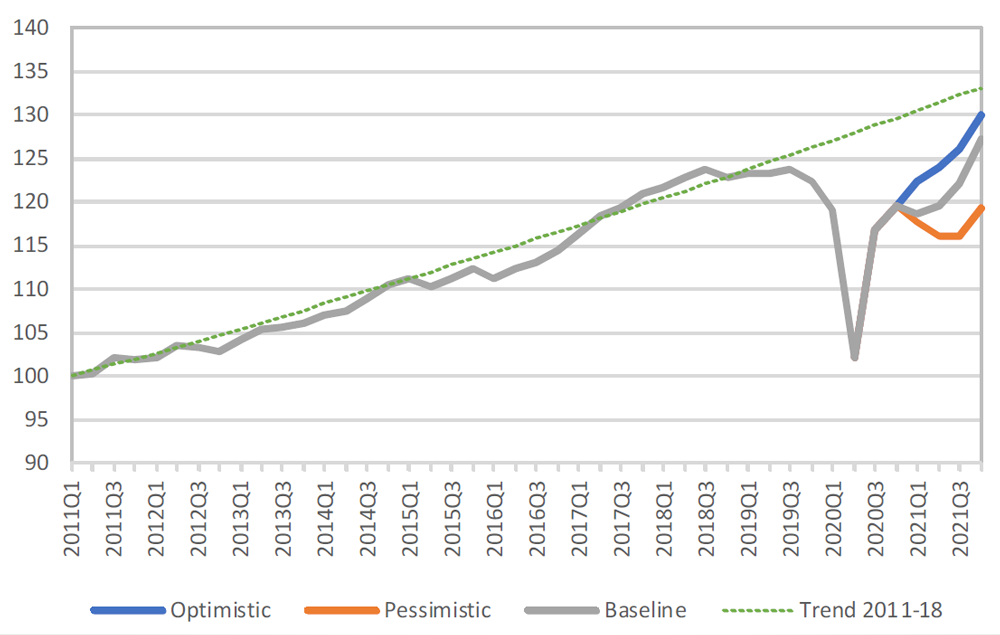
Chart 2: Merchandise trade volume optimistic and pessimistic scenarios
(Index, 2011Q1=100)
Source: WTO Secretariat estimates.
Possible trajectories for trade are illustrated by Chart 2. Under the optimistic scenario, second waves of COVID-19 would be better managed due to accumulated experience with the disease, resulting in more limited lockdowns and a smaller economic impact. Meanwhile, a pessimistic scenario might not feature a quick return to the pre-pandemic trend because of increased debt burdens, high unemployment, and limited early availability of vaccines.
Shifts in the sectoral and regional composition of trade have been important during the pandemic and will continue to exert an influence during the recovery.
Additional trade developments
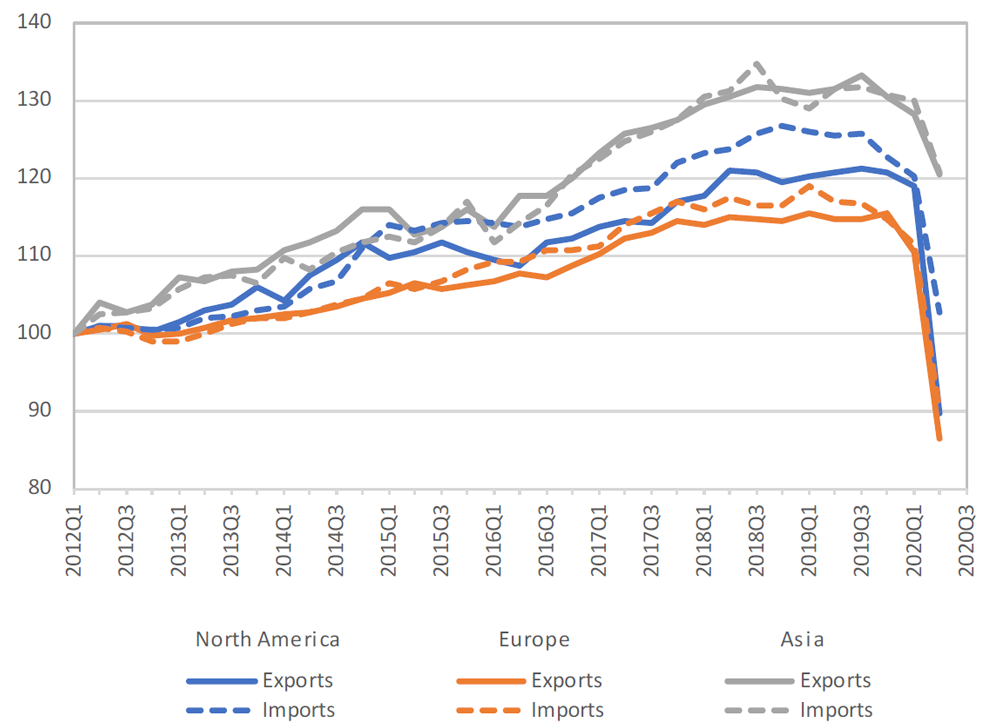
Global merchandise trade recorded its sharpest ever one-period decline in the second quarter, falling 14.3% compared to the previous period, but the impact differed strongly across regions (Chart 3). The steepest declines were in Europe and North America, where exports fell 24.5% and 21.8%, respectively. By comparison, Asian exports were relatively unaffected, dropping just 6.1%. During the same period imports were down 14.5% in North America and 19.3% in Europe but just 7.1% in Asia.
Chart 3: Merchandise exports and imports by region, 2012Q1-2020Q2
Volume index, 2012Q1=100
Source: WTO and UNCTAD.
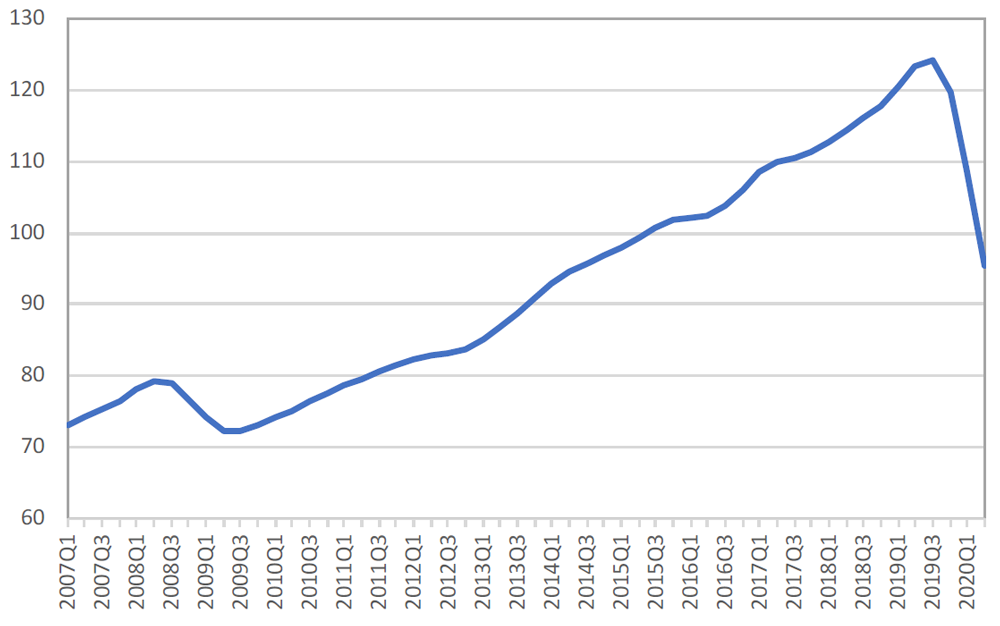
The decline in services trade during the pandemic has been at least as strong as the fall in merchandise trade. There are no comprehensive statistics on services trade in volume terms due to the general unavailability of price data, but an approximate measure of services trade volume can be derived by adjusting nominal commercial services trade statistics to account for exchange rates and inflation. This is illustrated by Chart 4, which shows a much steeper year-on-year decline in global services trade during the current recession (-23%, peak-to-trough) than during the financial crisis (‑9%). The plunge was exacerbated by restrictions on international travel, which represents a key source of export earnings for many low-income countries.
Chart 4: World services trade activity index, 2007Q1-2020Q2
Index, 2015=100
Source: WTO Secretariat estimates.
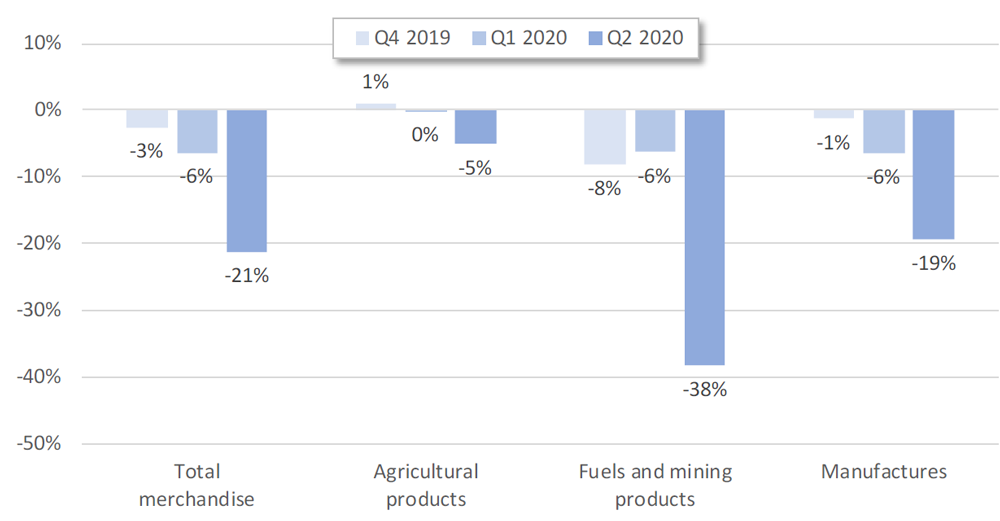
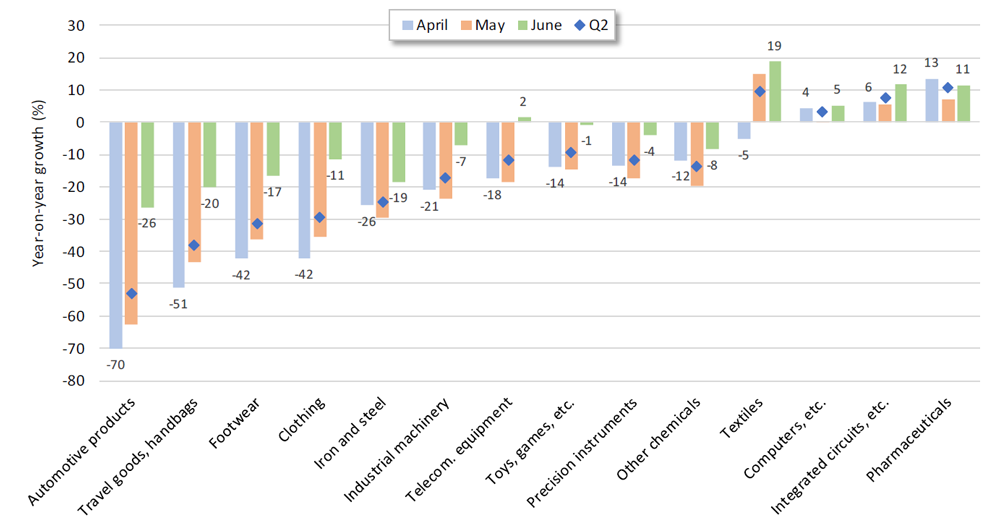
The COVID-19 pandemic has devasted trade in certain types of goods while encouraging trade in others. This phenomenon is illustrated by Chart 5, which shows quarterly year-on-year growth in the US$ value of world trade by broad product groups, and by Chart 6, which shows monthly year-on-year growth in various categories of manufactured goods. In the first chart we see that trade in agricultural products fell less than the world average in the second quarter (-5% versus -21%) since food is a necessity that continued to be produced and shipped even under the strictest lockdown conditions. Meanwhile, trade in fuels and mining products fell precipitously (‑38%) as prices collapsed and people consumed less owing to travel restrictions. The drop in manufactured goods trade (-19%) was comparable to the decline in merchandise trade overall.
Chart 5: Year-on-year growth in world merchandise trade, 2019Q4-2020Q2
% change in US$ values
Source: WTO Secretariat estimates.
Chart 6 shows that trade in most manufactured goods bottomed out in April before starting to recover in May and June, but that the recovery was partial and incomplete. Automotive products recorded the biggest decline of any category (-70% in April), partly as a result of supply disruptions and partly because of a lack of demand from consumers. By June, automotive products trade had picked up to the point where it was only down 26% compared to the previous year. As for the whole of the second quarter, trade in this product group was down 53%. Travel goods and handbags also recorded a steep decline in April since this category includes a large proportion of luxury goods, consumption of which tends to rise and fall in line with business cycles.
By June, trade in telecommunications equipment, which includes smart phones, had risen by 2% from the same period a year ago. Trade in other types of electronics also held up during the crisis as households, businesses and governments upgraded computers and information technology infrastructure to facilitate working from home. Unsurprisingly, trade in pharmaceuticals rose during the pandemic as countries secured essential products from foreign suppliers. Although it is not shown in Chart 6, trade in personal protective equipment (PPE) recorded explosive growth, up 92% in the second quarter and 122% in May, a dramatic example of the positive contribution that trade has made to overcoming the pandemic.
Chart 6: Year-on-year growth in world manufactured goods trade by product, 2020Q2
% change in US$ values
Source: WTO Secretariat estimates.
Supplementary indicators
Given the current extraordinary and often volatile economic conditions, we have set out to increasingly collect and analyse high-frequency data (i.e. statistics available at daily or weekly intervals). While the official data used in our models may lag for several weeks or months, relevant alternative high frequency data can provide early signs of changes in activity and trade by reflecting economic conditions at present. This can help in predicting current and subsequent data at longer, e.g. quarterly, intervals and provide a useful backdrop and context against which to check the plausibility of model outcomes. For illustration purposes, we have selected below two high frequency indicators related to trade – export orders and the number of international flights – and two variables reflecting economic activity and expectations – survey information from social media and copper futures.
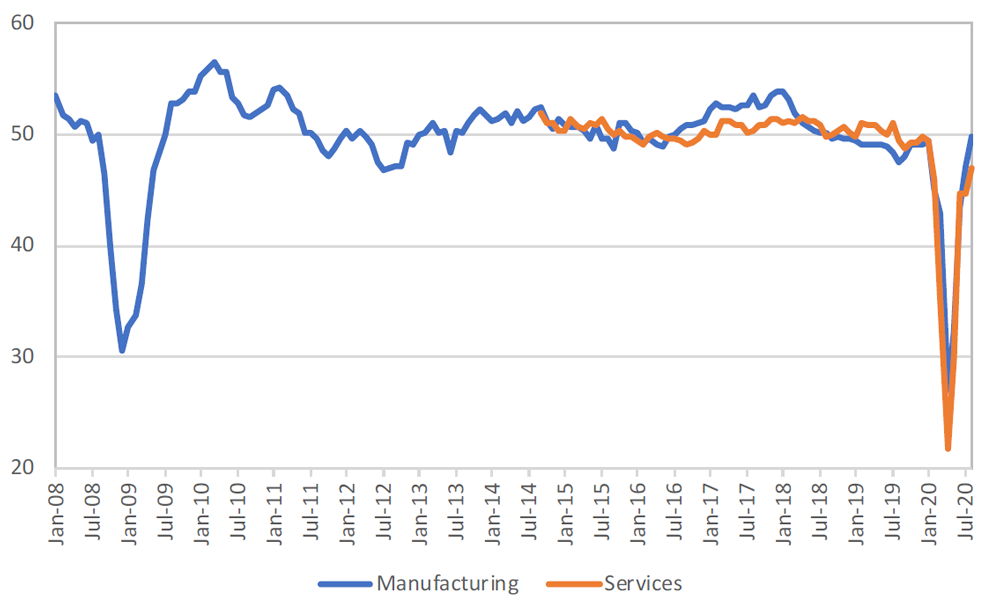
Chart 7: New export orders from purchasing managers’ indices, January 2008 – July 2020
(Index, base=50)
Note: Values greater than 50 indicate expansion while values less than 50 denote contraction.
Source: JPMorgan/IHS Markit.
Chart 7 shows export orders based on purchasing managers’ indices, which fell to record lows during the pandemic but have since rebounded sharply. The manufacturing index dropped to 27.1 in April, relative to a baseline of 50, while the service index fell to 21.8. The former was back on trend (49.9) at the end of August while the latter was near trend (47.1). Export orders tend to be a leading indicator of trade activity, but whether they retain their predictive power during the unusual COVID-19 pandemic remains to be seen.
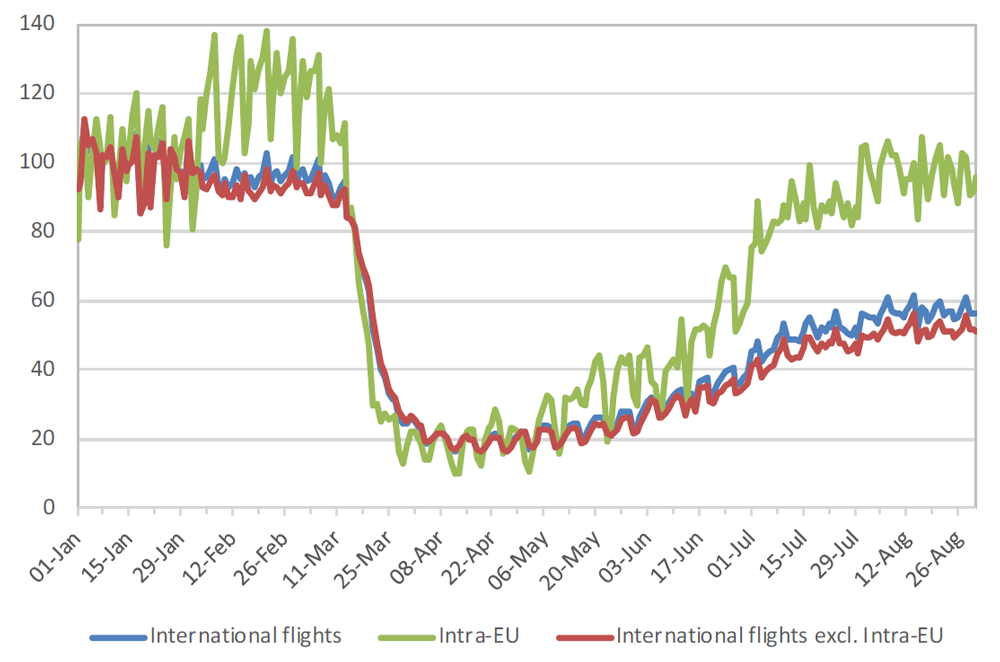
Chart 8: International commercial flights, 1 January 2020 — 31 August 2020
(Index, week of 1 January = 100)
Source: OpenSky Network and WTO Secretariat Calculations.
Chart 8 shows the number of international flights per day recorded by the OpenSky Network since the start of 2020. Flights worldwide fell around 80% between early January and mid-April, with international flights declining more than domestic ones. Total flights have recorded a gradual recovery since then, rising to 57% of their level at the start of the year. The recovery has been stronger within the European Union, with intra-EU flights rising to 95% of the level in January. Cargo flights could foreshadow recovery in goods trade while passenger flights suggest improvement in services trade.
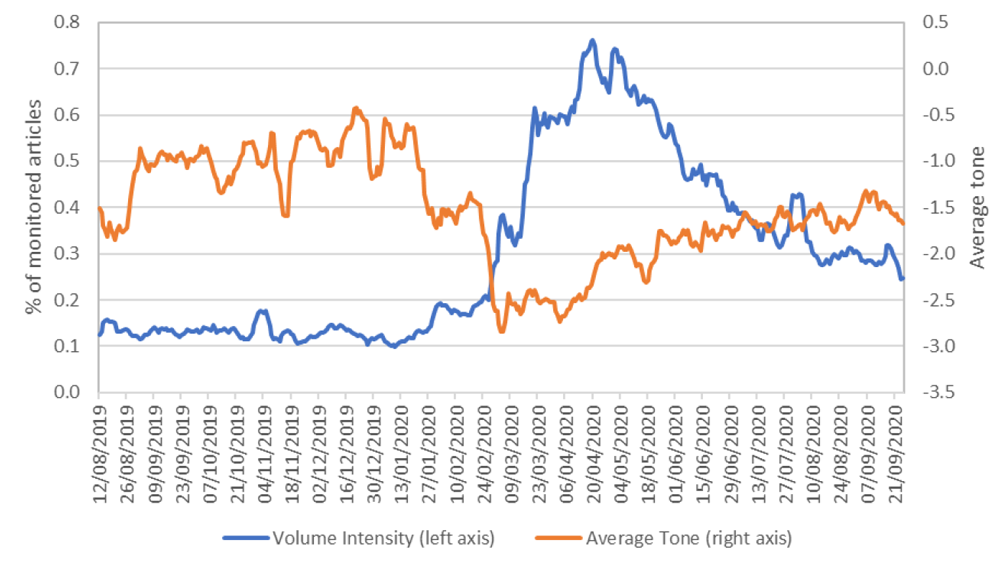
Chart 9: Illustration of phrases related to economic activity, 12 August 2019 – 25 September 2020
% and index
Source: The GDELT Project Summary Service.
Chart 9 shows the daily volume and average tone of news reports containing the phrase “economic activity”, as monitored by the GDELT Project Summary Service. Press reporting was already negative before the pandemic, bottoming out in March as the threat to the global economy became evident. Changes in tone since then suggest that views on the global economy were gradually improving, but that they have turned negative in recent days. This is a cause for concern and will be monitored going forward.
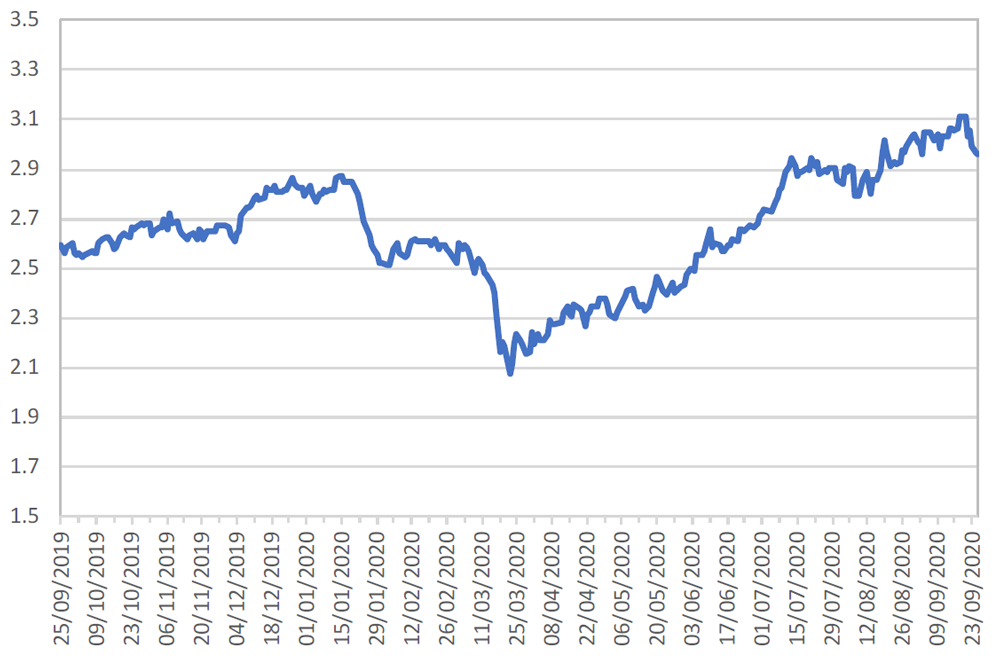
Chart 10 shows the daily price of futures contracts for copper, which is a widely recognized leading indicator of economic activity due to the importance of this metal in many areas of manufacturing. Standardized contracts are traded on the COMEX exchange, a division of the Chicago Mercantile Exchange (CME). Copper futures have risen 42% since mid-March, reflecting an overall improvement in economic sentiment that has taken a negative turn recently. This is another sign of concern that bears watching.
Chart 10: COMEX copper futures, 25 September 2019 — 25 September 2020
(US$ per pound)
Source: Chicago Mercantile Exchange (CME).


