The Office for National Statistics (ONS) released its April inflation figures this week.
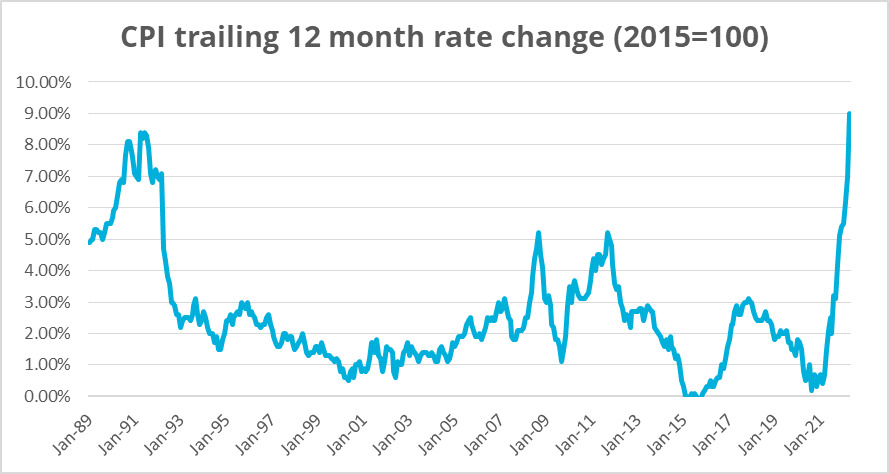
Accordion to the release, the twelve-month trailing inflation rate in the UK rose to 9% in April – the highest level since the current ONS data set began in 1989.
For many people, rising inflation does not come as a surprise.
The Russian invasion of Ukraine on February 24, 2022 and ensuing economic sanctions have sent shockwaves through the energy and commodities markets.
The drastic rise in inflation comes amid soaring energy prices, with many UK energy consumers experiencing £700-per-year increases in their energy bills.
According to many experts, inflation is only going to continue to rise.
Fuel and food prices are expected to grow as a result of the conflict, pushing the cost of living for many people even higher.
To better understand inflation, it is important to understand the consumer price index (CPI).
What is the consumer price index?
The consumer price index (CPI) is a measure of the monthly change in prices paid by consumers.
Governments around the world calculate this figure using weighted average prices for a basket of goods and services that represents what a typical household would purchase.
The exact weights used are amended frequently to remain representative of overall household (but not any one specific household) expenditure patterns .
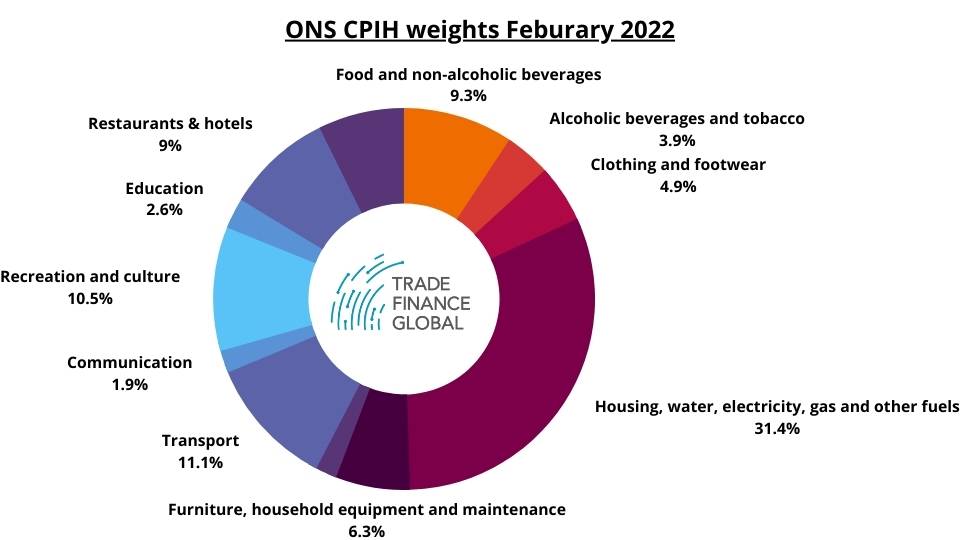
For example, in the UK the ONS divides CPIH (a variant of the consumer price index that also includes owner occupied housing costs) into 12 general categories, with the weights last updated in Feburary 2022.
Each country computes and reports its own CPI figures using its own weighting schemes to represent the typical purchasing behaviour of its typical household.
As a measure of inflation, CPI is really only useful as a time-series data set comparing what this basket of goods costs today compared to what it would have cost at a date in the past.
CPI data is always indexed to a certain date, which is 2015 for most OECD countries (although some countries index to different years – for example Canada indexes to 2002).
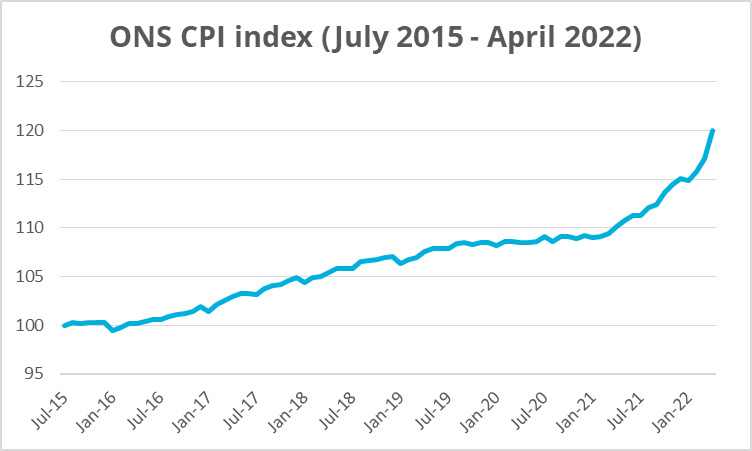
In the UK, the CPI for April 2022 is 120.0 indexed against a July 2015 value of 100.
This means that the basket of goods and services that the typical household purchased in April 2022 cost £120, while this same (albeit slightly weight-adjusted) basket of goods would have only cost £100 in July 2015.
This represents a 20% increase since the middle of the last decade – with more than half of that total increase coming the last 12 months.
Primary inflationary drivers today
There are three primary causes for the mounting inflation we have experienced in the last year: rising wages, energy prices, and increased demand.
1. Rising wages
According to data from Microsoft’s 2021 Work Trend Index, approximately 41% of people are likely to consider leaving their jobs within the next year.
This so-called “great resignation”, partly fueled by pandemic-enduced government assistance programs, is forcing many employers to offer higher wages to entice people back to the workplace.
Considering that for most companies payroll is the largest cost of doing business, a moderate percentage increase in wages will add substantial absolute costs to the business.
These costs, inevitably get passed on to consumers in the form of higher prices for the goods and services that the company provides.
As we learned, higher prices feed directly into the CPI, pushing this value, and thus inflation, higher.
2. Energy Prices
In April, electricity and gas bill increases accounted for three-quarters of the increase in inflation, according to the ONS.
Many consumers have experienced the skyrocketing energy bills that have come as a result of the sanctions against Russia.
In 2021, 40% of gas burned in the EU came from Russia.
With pressure from many pro-Ukranian sources to stop consumption of Russian energy, the total supply in the market has been slashed.
Coupled with this, demand for energy has been on the rise, fueled by increased economic activity as countries emerge from the pandemic and colder than usual temperatures this past winter and spring.
Declining supply paired with increasing demand leads to higher prices.
3. Increased money supply and general demand
The last primary reason for the recent inflationary spike comprises of two closely interrelated facets: increased money supply and higher demand.
During the peak of the COVID-19 crisis many governments around the world released ample supportive finance to assist citizens who were adversely impacted by lockdowns.
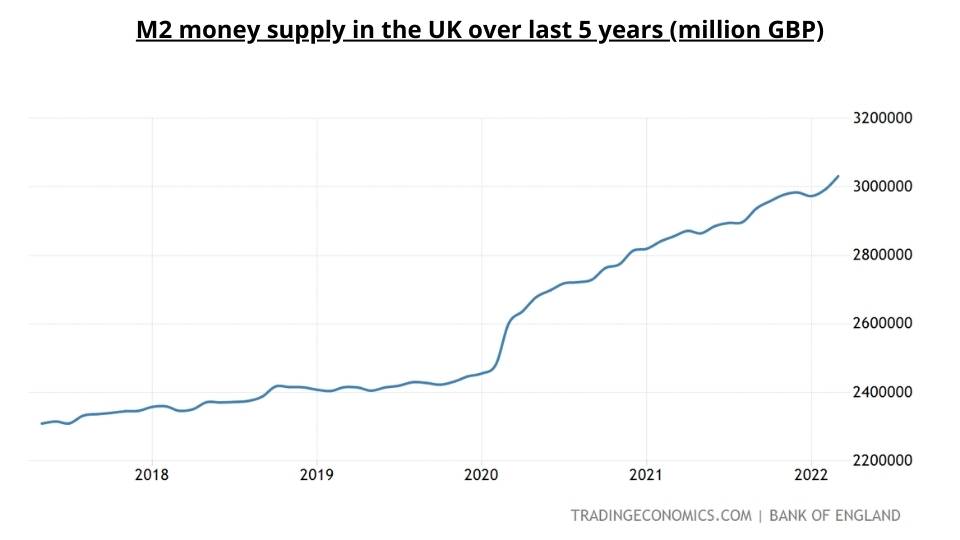
This led to a sharp increase in M2 – a measure of the money supply that includes cash, checking deposits, and easily-convertible near money – in early 2020, followed by steady growth in the years since.
M2 is a widely scrutinised metric and many consider it to be an indicator of future inflation.
In addition, this widespread and relatively equal distribution of new capital has led to increased consumer demand.
People have extra money and they want to spend it.
Even though prices are rising, pent up demand from the pandemic coupled with this additional cash means that consumer purchasing behaviour is not yet reflecting an inflationary environment.
Consumers are buying what they want and just accepting the fact that it is costing them a little bit extra to do so.
Part of this is powered by low-interest rates, still lingering after they were cut by many central banks at the start of the pandemic.
Low rates – which are just beginning to increase in many countries – mean that it is less expensive for consumers to make purchases using borrowed money. For trade finance, low CPI rates mean less purchasing – find out more about what is CFD here.
Effectively, more money generally has driven larger amounts of demand for many goods that suppliers are unable to increase production to match.
Again, we run into a situation of supply and demand economics pushing prices higher.
Read the latest issue of Trade Finance Talks, June 2022
