


Estimated reading time: 10 minutes
Most discussions of industrial policies centre on the manufacturing sector, overlooking the fact that services sectors account for much larger shares of almost every nation’s GDP. The service sector trade also continues to grow faster than goods trade. Yet little is known about the range of selective policy interventions deployed in services sectors.
We leverage the World Trade Organization’s Trade in Services by Mode of Supply (TISMOS) dataset and match it to data on selective policy interventions from the Global Trade Alert (GTA), which implicates the services sector. This helps to shed light on selective corporate subsidy interventions and their potential link to service sector exports.
Services trade dynamics: Stylised facts from the TISMOS database
TISMOS classifies trade in services by four modes of supply:
- Cross-border supply: Services are delivered from one country’s territory to another, without the movement of either the consumer or the producer. Only the service itself crosses the border. For example, a university in the UK offering online courses to a student based in India.
- Consumption abroad: Services are provided within a country to consumers from another country. This includes individuals travelling to another country to access services, such as visiting museums, theatres, doctors, or attending language courses. It also encompasses services related to the consumer’s property while abroad, like ship repairs.
- Commercial presence: Services are provided by businesses or professional establishments from one country through a commercial presence in another country. For example, a British bank opening a branch in India to offer banking and financial services to local customers.
- Presence of natural persons: Services are provided by individuals from one country through their temporary presence in another country. Examples include a computer services company sending an employee to a client in another country, or a self-employed lawyer travelling abroad to offer legal advice.
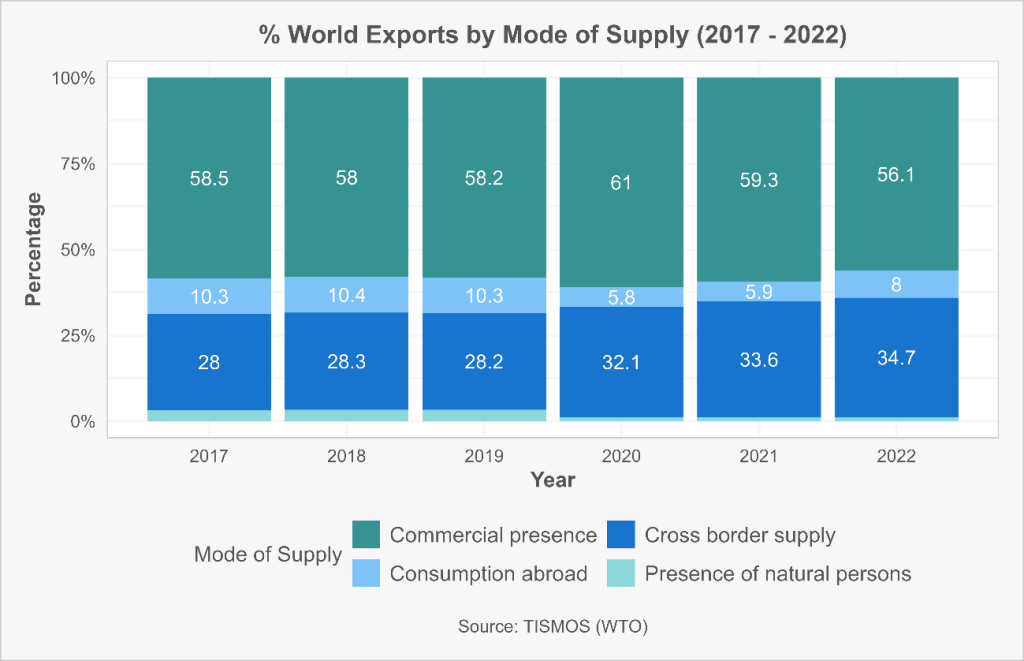
While commercial presence remains the dominant form of service exports, there has been a shift since the COVID-19 pandemic in favour of cross-border supply. Although this shift might suggest that in-person service delivery has declined in favour of exchanges that do not require physical presence, the percentage change from 2017 to 2022 reveals an upward trend in both commercial presence and cross-border supply.
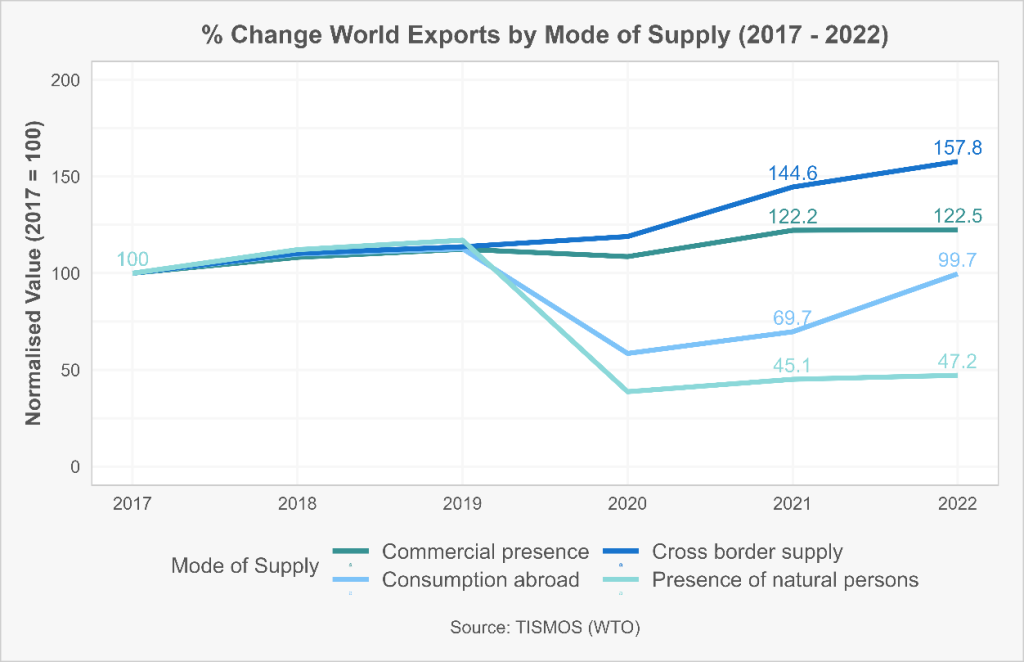
Figure 2. Percentage Change World Exports of Services by Mode of Supply
The decline in the global share of commercial presence can primarily be attributed to a greater percentage increase in other categories. Foreign suppliers’ continued establishment of local affiliates signals that companies still value close contact throughout various stages of service delivery, including production, distribution, marketing, sales, and after-sales support. Additionally, there is potential for recovery in services provided within one country to consumers from another, as well as services related to a consumer’s property abroad. In particular, sectors such as tourism seem to have considerable growth potential.
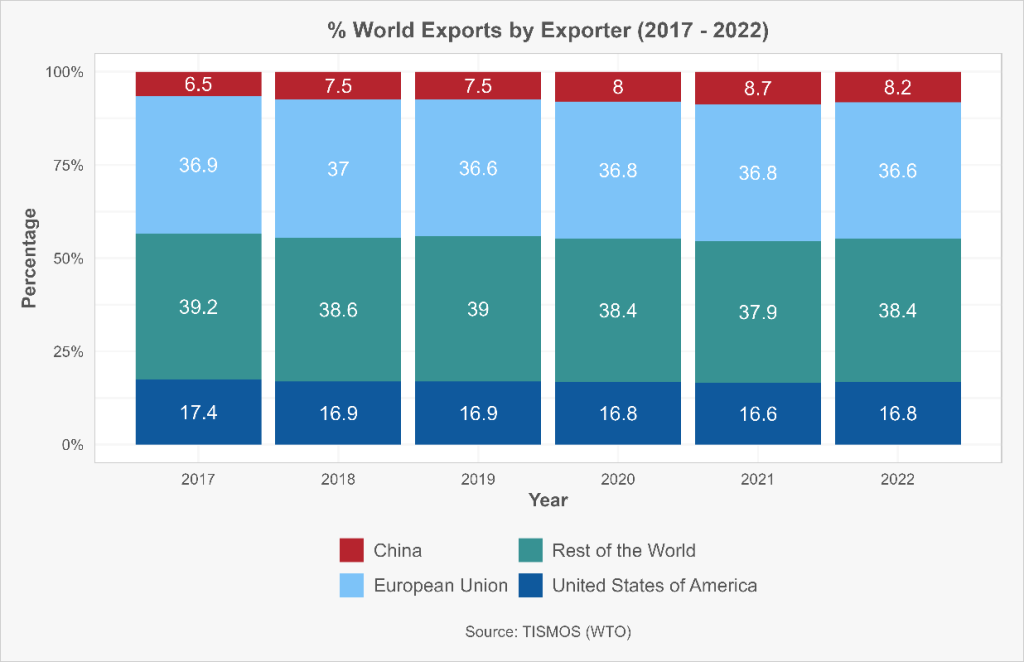
The TISMOS database allows services trade to be broken down by major exporter. As per Figure 3, over 50% of global service exports come from the EU and the USA combined. In 2022, China accounted for only 8.2% of total world service exports. The implications of this high concentration in the service sectors are significant. First, trade partners may need to align with US and EU regulations to export services, giving these countries leverage over global trade standards and substantial bargaining power in trade agreements. For instance, while these trade partners do not need to fully align with such foreign regulations in the US or the EU and its member countries, they do need to provide a regulatory environment that allows domestic companies to adhere to them. Take for example Germany’s Supply Chain Act which mandates corporate and contractual due diligence obligations as well as their enforcement across borders. Countries which are considered high risk for breaking the Act’s conditions face divestment from large corporations.
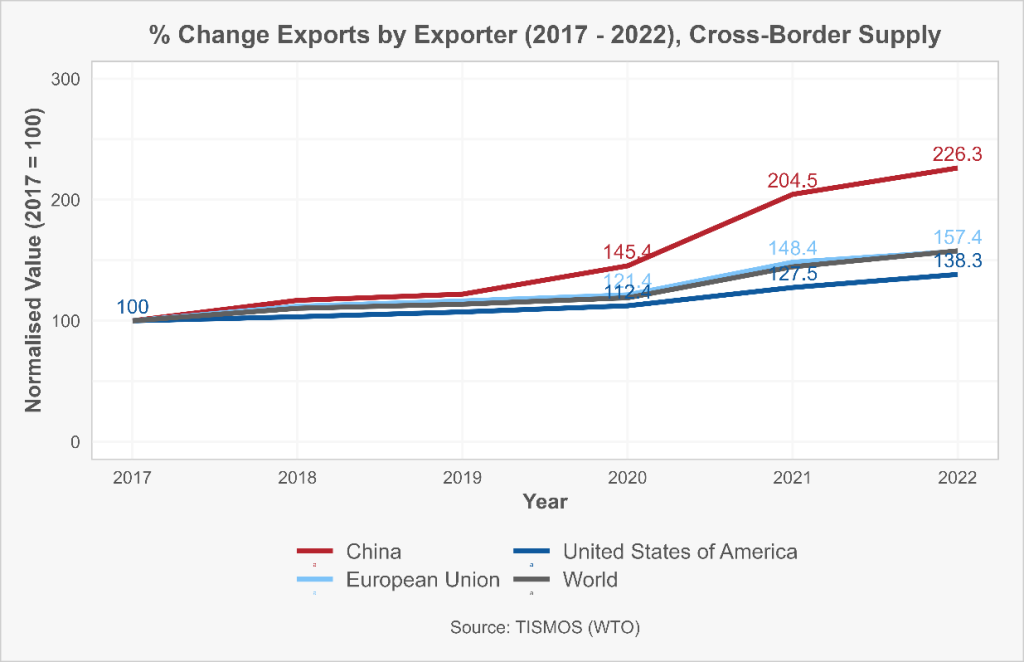
Simultaneously, there are also strategic opportunities for emerging markets to expand business sectors related to digital transformation and remote services, which can support economic diversification policy initiatives. Figure 4 reveals that China has experienced higher-than-average growth (126%) in cross-border supply service exports compared to the global total, particularly after 2020; the EU-27 also increased its exports by 57.8%. Despite these large increases, China’s share of world exports in 2022 remained less than 10% and was smaller than the previous year. Nevertheless, the surge in cross-border supply services shows that some emerging economies can potentially capture a larger share of the benefits from global service trade more easily.
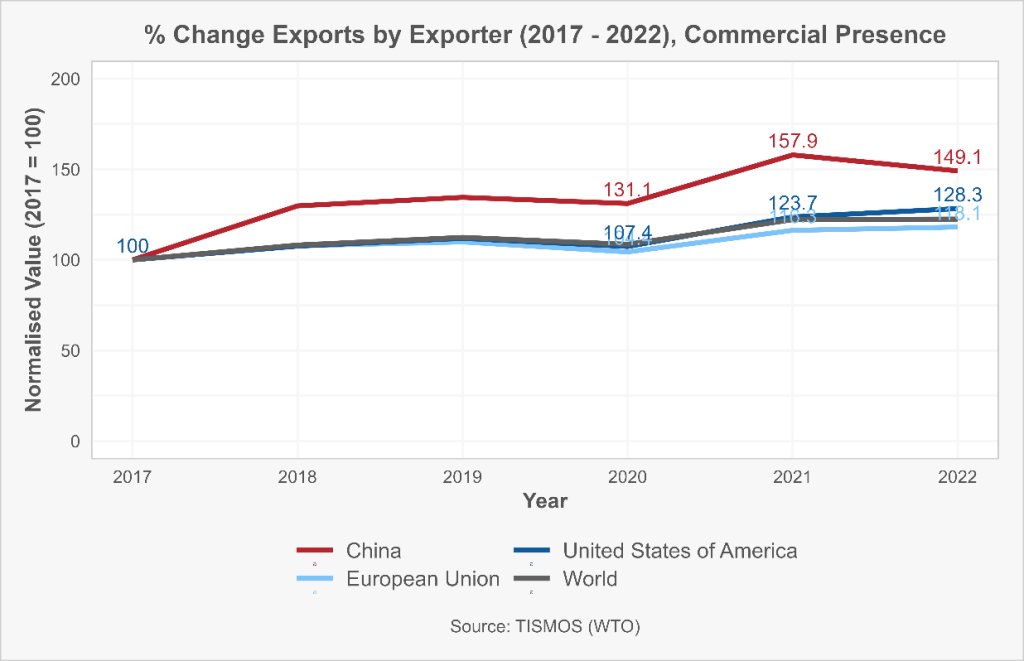
What about services that require a commercial presence in another country? Figure 5 shows a significant increase in Chinese exports, although there was a retreat in 2022 compared to 2021. On the other hand, the US maintained its rising trend in 2022, while the EU’s exports performed below the world average. This highlights the strength of US multinational service firms, which continue to expand by setting up subsidiaries or acquiring foreign firms. US companies tend to prefer direct market entry or local presence over cross-border transactions.
For example, IBM has established numerous research and development centres around the world, allowing it to localise its technology solutions and provide closer support to regional markets. Microsoft has established data centres worldwide to support its cloud services, ensuring low latency and compliance with local data regulations. Finally, McDonald’s exemplifies direct market entry by setting up thousands of franchises globally, adapting its menu to local tastes while maintaining a consistent brand experience. Despite the increasing share of Chinese service exports, US firms continue to dominate, maintaining a strong influence in global markets. However, establishing a physical presence abroad exposes US multinationals to political risks in host countries.
For the EU, stricter regulations such as the GDPR, financial regulations, and fragmented national markets make expansion less seamless compared to the US. One explanation is that services trade overall is considered two to three times more expensive than goods trade, with strong heterogeneity in trade costs across countries. Even more so, services trade has seen relatively little cost improvement in the last two decades while the costs for trade in goods continue to decline. Yet even when the EU seeks to introduce uniform regulatory frameworks to enhance trade conditions, it must first address a wide range of diverse national regulatory frameworks. The 2024 Draghi report has stated that this fragmentation of the single market was left untouched for too long and stressed the need to tackle the EU’s fragmented single market to remain competitive in the global economy.
In China’s case, dominance in some digital platforms allows for direct online service exports, reducing the need for firms to establish operations abroad. Geopolitical tensions and investment barriers may limit Chinese firms’ ability to expand through foreign direct investment (FDI), but these challenges also drive them to focus on cross-border digital services. Recent trade restrictions, like tariffs such as the U.S. government’s export controls or the banning of Chinese telecom equipment by several countries, may also incentivise Chinese companies to establish operations abroad to avoid these barriers.
For example, Türkiye has imposed higher tariffs on imported EVs while simultaneously offering incentives such as tax breaks, land grants, and subsidies to foreign manufacturers. This strategy aims to encourage Chinese EV companies, like BYD or NIO, to establish production facilities within Türkiye. In a similar fashion, the EU has introduced anti-dumping duties on Chinese imports of batteries and related components to protect its domestic battery industry. At the same time, it has established initiatives like the European Battery Alliance, offering financial incentives and regulatory support to attract Chinese companies, such as CATL and BYD, to set up battery manufacturing plants in the EU. These trade barriers could also present an opportunity for China to increase its commercial presence in certain markets, potentially leading to a shift in the global service trade landscape.
A deeper dive into selective subsidy intervention shaping service sectors
The GTA database is well suited to examine selective subsidy intervention favouring firms in services sectors. Consumer subsidies that do not have nationality-based discriminatory strings attached are not covered in the GTA. So, the focus here will be on subsidy receipt by services producers.
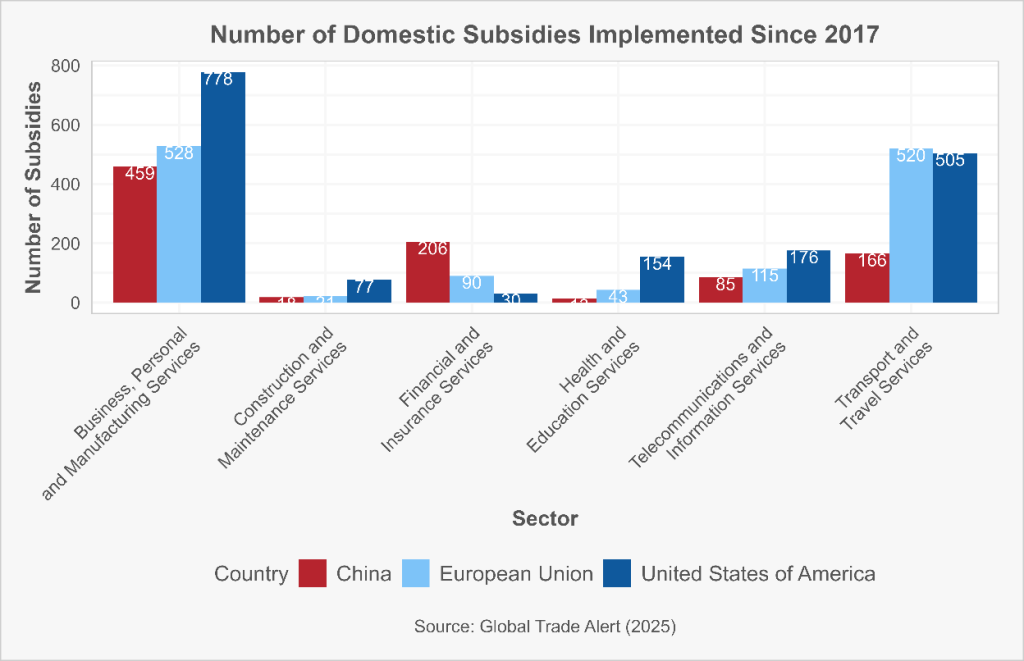
Since 2017 the most corporate subsidies awarded by China, the EU, and the US were to producers in the Business, Personal, and Manufacturing Services sector. This aggregate sector includes manufacturing services for physical inputs owned by others, intellectual property usage charges, business services (excluding trade-related), heritage, and recreational services, among others. The US is the jurisdiction that most often grants subsidies to companies in this sector, while the EU allocates the largest number of subsidies to the transport and travel services sector. China is the leader in subsidising the financial and insurance services sector.
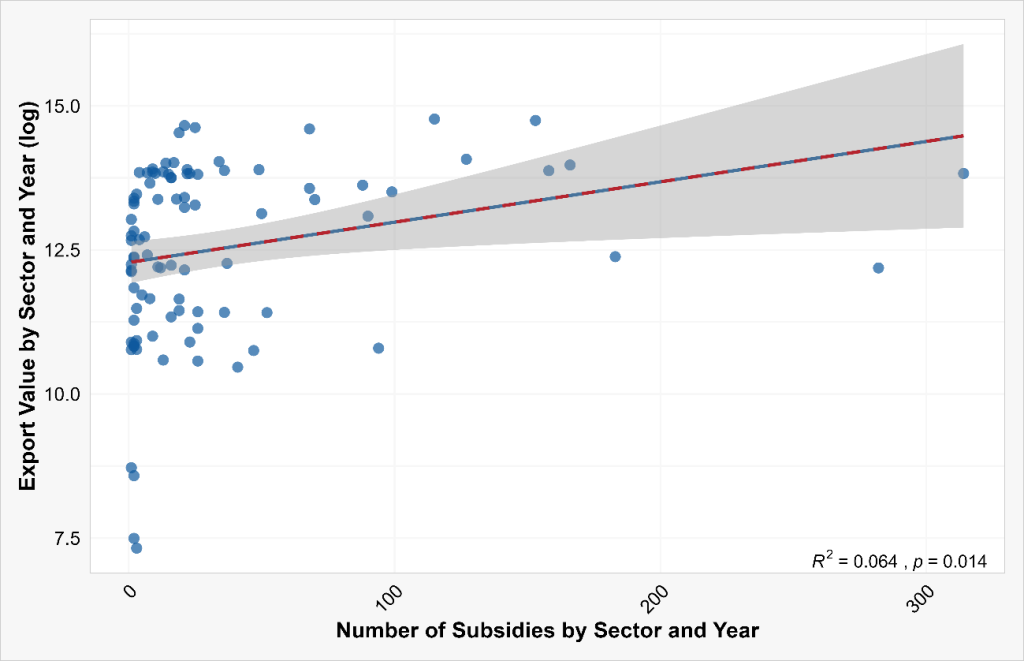
Figure 7 explores the relationship between a country’s exports by sector and the number of subsidies awarded each year. The relationship is both positive and significant, with a correlation coefficient of 0.4. This indicates that China, the EU, and the US tend to subsidise sectors that have a larger volume of exports. While this does not establish the direction of causality, the finding is consistent with the following interpretation: subsidies are being strategically used to support services sectors with demonstrated comparative advantage. Further analysis could establish whether today’s service export success stories were supported during their nascent scale-up phase.
Towards a better understanding of service sector promotion policies
Greater transparency is essential to better understand the trends and dynamics in the trade of services. The WTO’s TISMOS initiative, combining information on modes of supply, sectors, and trade flows, represents a significant step in this direction. Additionally, the GTA database tracks industrial policies and trade measures affecting the service sector. Much could be learned by combining these data sources—in this, we have only scratched the surface.
Our findings suggest different country services providers prefer different modes of supply. The US, for example, continues to prioritise commercial presence, leveraging the strength of its multinational service firms and direct market access. In contrast, China is increasingly focused on cross-border supply, driven by its expansion in digital services such as software development, AI, cloud computing, and digital finance. However, whether rising trade barriers will incentivise China to establish a stronger commercial presence in certain importing countries remains to be seen.
Furthermore, China, the EU-27, and the US tend to grant more subsidies to service sectors where their exports are largest, suggesting that industrial policies in these countries could well be reinforcing strategic competitive advantages.
—
As the world enters 2025, the trends identified between 2019 and 2022—particularly the shift towards cross-border service supply and the growing influence of China in digital services—are expected to continue shaping global trade dynamics. Rising geopolitical tensions and new looming trade barriers promised by the second Trump administration may encourage countries like China to further expand their commercial presence in foreign markets, adapting to the changing regulatory and political landscape. Meanwhile, the EU and US are likely to maintain their focus on subsidising key service sectors with competitive export advantages, continuing to leverage selective policies to secure their positions in the global service trade.