Importing from Switzerland


Switzerland Country Profile
Official Name (Local Language) Schweizerische Eidgenossenschaft; Confederation Suisse; Confederazione Svizzera; Confederaziun Svizra
Capital Bern
Population 8,179,294
Currency Swiss Franc
GDP $662.5 billion
Languages French; German; Italian; Romansh
Phone Dial In 41
Switzerland Exports Profile
Exports ($m USD) 299,309
Number of Export Products 4,316
Number of Export Partners 227
Switzerland Economic Statistics
Government Website | https://www.admin.ch/ |
| Sovereign Ratings | https://countryeconomy.com/ratings/switzerland |
| Central Bank | Schweizerische Nationalbank |
| Currency USD Exchange Rate | 0.9992 |
| Unemployment Rate | 3.3% |
| Population below poverty line | 6.6% |
| Inflation Rate | -0.4% |
| Prime Lending Rate | 0.5% |
| GDP | $662.5 billion |
| GDP Pro Capita (PPP) | $59,400 |
| Currency Name | Swiss Franc |
| Currency Code | CHF |
| World Bank Classification | High Income |
| Competitive Industrial Performance | 1/138 |
| Corruption Perceptions Index | 3/180 |
| Ease of Doing Business | 38/190 |
| Enabling Trade Index | 11/136 |
Access trade, receivables and supply chain finance
We assist companies to access trade and receivables finance through our relationships with 270+ banks, funds and alternative finance houses.
Get StartedImporting from Switzerland
In terms of size, Switzerland is the sixteenth largest export economy in the world and the second most complex economy according to the Economic Complexity Index (ECI). The growth in the economy has remained relative steady on an upwards trajectory. In general, Switzerland exported around $310B and imported around $250B, which resulted in a positive trade balance of around $60B. Yearly, the GDP of Switzerland is around $690B, which is a GDP per capita of around $55k.
The top imports from Switzerland are gold (around $41B), packaged medicaments (around $15B), cars ($10B), jewellery (around $8B) and around refined petroleum ($7B). The top import origins are Germany (around $60B), the United States (around $25B), Italy (around $24B), France (over $15B) and China ($11B).
Importing from Switzerland: What is trade finance?
Switzerland has an efficient market economy. Its standard of living, industrial productivity and quality of education and health care systems are among the highest in Europe. After contracting due to the Eurozone crisis, Swiss growth reached 0.8% in 2015 and 1.3% 2016. According to Swiss State Secretariat for Economic Affairs and the IMF, growth remained at 1% in 2017, lower than initial forecasts (1.3%). Swiss growth also remained below the European average (2.5%) in 2017, for the second time in row (which was a first in 2016 since the creation of euro).
Chart Showing GDP Growth Compared to rest of world
GDP Composition for Switzerland
Agriculture
0.7%
Grains, fruits, vegetables; meat, eggs, dairy products
Industry
25.9%
Machinery, chemicals, watches, textiles, precision instruments, tourism, banking, insurance, pharmaceuticals
Services
73.4%
NA
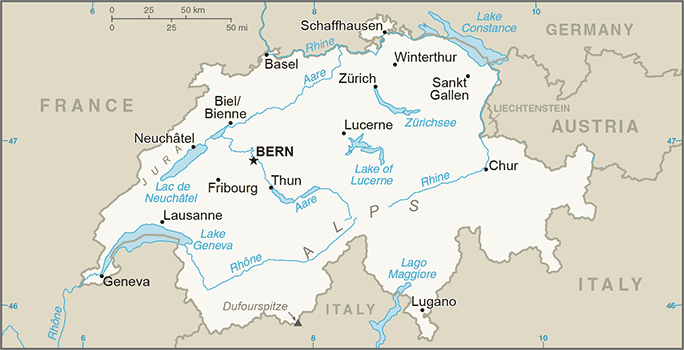
Map
Top 5 Exports Partners
| Country | Trade | % Partner Share |
| Germany | 45,312 | 15.14 |
| United States | 36,675 | 12.25 |
| China | 24,493 | 8.18 |
| India | 19,900 | 6.65 |
| France | 17,128 | 5.72 |
Top 5 Exports Products
| Export Product | Number |
| Gold in unwrought forms non-monetary | 22.7% |
| Other medicaments of mixed or unmixed products, | 13.7% |
| Human and animal blood; microbial cultures; tox | 9.4% |
| Art. of jewellery and pts thereof of/o prec mtl | 4.2% |
| Wrist-watches with automatic winding nes | 3.7% |
Local Partners
- All Topics
- Switzerland Trade Resources
- Export Finance and ECA Topics
- Local Conferences


