Importing from Norway


Norway Country Profile
Official Name (Local Language) Kongeriket Norge
Capital Oslo
Population 5,265,158
Currency Norwegian Kroner
GDP $376.3 billion
Languages Norwegian
Phone Dial In 47
Norway Exports Profile
Exports ($m USD) 85,526
Number of Export Products 4,367
Number of Export Partners 200
Norway Economic Statistics
Government Website | https://www.regjeringen.no/ |
| Sovereign Ratings | https://countryeconomy.com/ratings/norway |
| Central Bank | Norges Bank |
| Currency USD Exchange Rate | 8.615 |
| Unemployment Rate | 4.4% |
| Population below poverty line | NA |
| Inflation Rate | 3.5% |
| Prime Lending Rate | 6.25% |
| GDP | $376.3 billion |
| GDP Pro Capita (PPP) | $69,300 |
| Currency Name | Norwegian Kroner |
| Currency Code | NOK |
| World Bank Classification | High Income |
| Competitive Industrial Performance | 11/138 |
| Corruption Perceptions Index | 3/180 |
| Ease of Doing Business | 7/190 |
| Enabling Trade Index | 17/136 |
Access trade, receivables and supply chain finance
We assist companies to access trade and receivables finance through our relationships with 270+ banks, funds and alternative finance houses.
Get StartedImporting from Norway
Imports in Norway are at around NOK 51000 million, which is mainly driven by machinery, transport equipment and miscellaneous manufactured articles. The imports have been at an average level of about 16000 NOK Million from around 1960 until 2015, which has reached a height of around 64000 NOK Million at the start of 2015 and a record low of almost 700 NOK Million in the middle of 1960.
The main imports are machinery and transport equipment (around 40%), manufactured articles (around 15%), food (around 6%), crude materials (around 6%) and mineral fuels (around 5%). The main import partners are Sweden (around 11%), Germany (around 10%), China (around 10%), the UK and the US (6%). The developed economy of
Norway is supported by a strong shipping industry in order to support the export sector. This has been complimented by the high availability of natural resources, which has included petroleum exploration, fisheries and power relating to hydroelectrics. Agriculture and heavy manufacturing have reduced compared to oil-related companies.
Importing from Norway: What is trade finance?
Imports in Norway are at around NOK 51000 million, which is mainly driven by machinery, transport equipment and miscellaneous manufactured articles. The imports have been at an average level of about 16000 NOK Million from around 1960 until 2015, which has reached a height of around 64000 NOK Million at the start of 2015 and a record low of almost 700 NOK Million in the middle of 1960.
The main imports are machinery and transport equipment (around 40%), manufactured articles (around 15%), food (around 6%), crude materials (around 6%) and mineral fuels (around 5%). The main import partners are Sweden (around 11%), Germany (around 10%), China (around 10%), the UK and the US (6%). The developed economy of
Norway is supported by a strong shipping industry in order to support the export sector. This has been complimented by the high availability of natural resources, which has included petroleum exploration, fisheries and power relating to hydroelectrics. Agriculture and heavy manufacturing have reduced compared to oil-related companies.
Chart Showing GDP Growth Compared to rest of world
GDP Composition for Norway
Agriculture
1.8%
Barley, wheat, potatoes; pork, beef, veal, milk; fish
Industry
34.7%
Petroleum and gas, shipping, fishing, aquaculture, food processing, shipbuilding, pulp and paper products, metals, chemicals, timber, mining, textiles
Services
63.5%
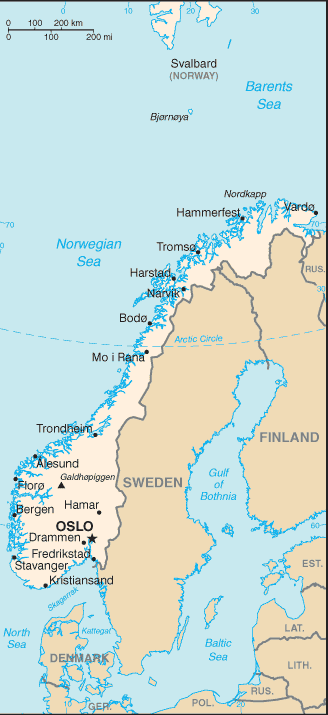
Map
Top 5 Exports Partners
| Country | Trade | % Partner Share |
| United Kingdom | 21,523 | 21.11 |
| Germany | 15,823 | 15.52 |
| Netherlands | 6,739 | 9.94 |
| Sweden | 6,739 | 6.61 |
| France | 6,570 | 6.44 |
Top 5 Exports Products
| Export Product | Number |
| Petroleum oils and oils obtained from bituminou | 7.4% |
| Natural gas in gaseous state | 5.2% |
| Fresh or chilled Pacific, Atlantic and Danube s | 2.8% |
| Petroleum oils, etc, (excl. crude); preparation | 2.1% |
| Aluminium unwrought, alloyed | 2.0% |
Local Partners
- All Topics
- Norway Trade Resources
- Export Finance & ECA Topics
- Local Conferences


