Importing from Egypt
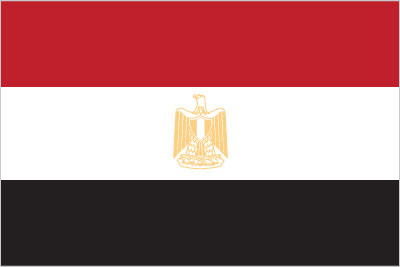

Egypt Country Profile
Official Name (Local Language) Jumhuriyat Misr al-Arabiyah
Capital Cairo
Population 94,666,993
Currency Egyptian Pound
GDP $342.8 billion
Languages Arabic
Phone Dial In 20
Egypt Exports Profile
Exports ($m USD) 25,943
Number of Export Products 2,635
Number of Export Partners 171
Egypt Economic Statistics
Government Website | https://www.egypt.gov.eg/english/home.aspx |
| Sovereign Ratings | https://countryeconomy.com/ratings/egypt |
| Central Bank | Central Bank of Egypt |
| Currency USD Exchange Rate | 9.71 |
| Unemployment Rate | 13.1% |
| Population below poverty line | 25.2% |
| Inflation Rate | 12.1% |
| Prime Lending Rate | 9.75% |
| GDP | $342.8 billion |
| GDP Pro Capita (PPP) | $12,100 |
| Currency Name | Egyptian Pound |
| Currency Code | EGP |
| World Bank Classification | Lower Middle Income |
| Competitive Industrial Performance | 115/138 |
| Corruption Perceptions Index | 117/180 |
| Ease of Doing Business | 120/190 |
| Enabling Trade Index | 116/136 |
Access trade, receivables and supply chain finance
We assist companies to access trade and receivables finance through our relationships with 270+ banks, funds and alternative finance houses.
Get StartedImporting from Egypt
Egypt is one of Africa’s largest and most resilient economies, as well as an important trade partner for Southern Europe and the Middle East, with a solid trade deficit. Its biggest exports are oil, gas, nitrogenous fertiliser, and gold; the main export destinations are Turkey, India, Italy, and Spain.
As a neutral player between East and West, Egypt has attracted investment from both Europe and the Middle East to grow its energy sector and strengthen trade relationships with both. Egyptian infrastructure, especially its port and mining industry, could benefit from modernisation, and investment in its roads and ports is likely to increase trade both inside Africa and with its overseas neighbours. Investment in green energy sources and hydrogen production, including for fertilisers, is also increasing: this comes at a pivotal moment when Egypt’s own gas production is dwindling, leading to decreased exports and frequent blackouts.
Domestically, Egypt is experiencing turbulent protests over the government’s response to the Israel-Gaza conflict, as well as direct fallout from the war. While protests have technically been restricted to avoid a recurrence of the unrest seen during the Arab Spring, rising prices domestically as well as fears over a spillover of the conflict have led to a turbulent domestic situation and occasional government repression of protesters. As the macroeconomic situation improves and the Gaza conflict stabilises, however, it is likely that tensions will ease and exports will stop being impacted.
Importing from Egypt: What is trade finance?
Due to the agricultural and industrial sectors that are not well-developed, it has been forecasted that Egypt would rely on the imports for most of its food, commodities and equipment. It has been reported Egypt’s import volumes reached to $43.98 billion which shows a 24% increase from the last year’s level. The country’s top imports would include oil products like refined petroleum ($6.6 billion) and crude petroleum (about $2 billion), and food commodities such as wheat ($2.5 billion) and corn ($1.5 billion).
Accounting for more than 10% of Egypt’s total imports is the United States, then followed by China with 10%, Italy at around 7%, Germany with 6.8% and last, by Saudi Arabia for 4.9%.
As reported by the Central Agency for Public Mobilization and Statistics, the highest peak of Egypt’s imports reached $7,111 million in August 2014 and hit its lowest points in July 1957 with on $33.05 million. In average from 1957 until 2015, imports in Egypt maintained at $1,222 million.
The country’s major import commodities would include mineral and chemical products that comprises 25% of total imports, agricultural products, livestock and food items which altogether forms about 24%, 13% for electrical equipment and machinery and base metals. In addition to these items, Egypt is also a known exporter of artificial resin, vehicles, textiles and footwear and wood products.
Egypt’s main import partner is the United States which accounts 10% of its total imports, then succeeded by China with 9.9%, Italy at around 7%, Germany with 6.8% and last, by Saudi Arabia for 4.9%.
Chart Showing GDP Growth Compared to rest of world
GDP Composition for Egypt
Agriculture
11.3%
Cotton, rice, corn, wheat, beans, fruits, vegetables; cattle, water buffalo, sheep, goats
Industry
35.8%
Textiles, food processing, tourism, chemicals, pharmaceuticals, hydrocarbons, construction, cement, metals, light manufactures
Services
52.9%
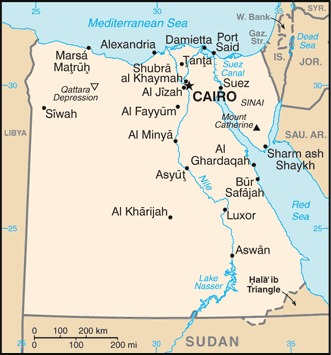
Map
Top 5 Exports Partners
| Country | Trade | % Partner Share |
| United Arab Emirates | 2,741 | 10.56 |
| Italy | 2,199 | 8.48 |
| Turkey | 1,867 | 7.19 |
| Saudi Arabia | 1,551 | 5.98 |
| United States | 1,328 | 5.12 |
Top 5 Exports Products
| Export Product | Number |
| Petroleum oils, etc, (excl. crude); preparation | 9.4% |
| Petroleum oils and oils obtained from bituminou | 8.1% |
| Gold in unwrought forms non-monetary | 8.1% |
| Urea | 3.8% |
| Television receivers including video monitors a | 3.0% |
Local Partners
- All Topics
- Egypt Trade Resources
- Export Finance & ECA Topics
- Local Conferences


