Even though traders, business people, and governments desire it and major financial actors try to maintain it, stability on the Foreign Exchange market is only fleeting.
The Volatile Markets
Forex volatility portrays in a more visible manner the reality of every market – that everything we trade has a relative value. However, while a bottle of water is of value relative to the price of soda, for example, but also in itself, currencies cannot stand on their own.
As such, they are always traded in pairs, forming interconnected links. Based on price movement and moving averages, currency pairs with the highest and lowest levels of volatility are always measured and monitored.
Forex Volatility
In any market, there are three points – one in which the demand increases; one in which supply increases and finally one in which an equilibrium between the two is reached. This latter point happens at the meeting of the supply and demand curves. It means that sellers have who to sell to and buyers have who to buy from. Every one of them.
However, if the product or service-based markets pass through these points in years or business cycles, the Forex market does so within minutes. Even if the price of a currency reverts around a resistance point, the trading done in it during the day can push it higher or lower values.
The most common occurrence is for the value of a currency to drop because of increases in the money supply. When the market is flooded with dollars, and everyone has dollars, for example, the dollar itself becomes cheaper.
Keeping track of the volumes that are exchanging hands at any time is, therefore, a primary concern of traders. Most do so by following a Volumes Indicator, usually incorporated into indicators and programs.
While the market raw data provides it in real time, the volumes traded are kept as a close secret by banks, as knowing it is a first step in decoding the entire behaviour of an actor on the Forex market.
Why is Forex volatile?
Adam Smith, the 18th-century economist that impacted modern economy most heavily, had faith that the “invisible hand” of the market was going to regulate prices naturally through supply and demand.The volatility of the Forex market is the day to day embodiment of his theory.
Aside from the interplay of supply and demand, political events, declarations from central bank officials, reports on the national economy or the failure to secure cheap credit can cause drops in a country’s currency.
As these events occur so often and as currencies are interconnected, being traded in pairs, Forex volatility is not only inbuilt but sustained and encouraged.
However, while the prices may jump up and down, most of the time they linger around resistance points.
These can be formed naturally when most traders believe that the currency has hit a high point and start to sell. If this happens more than once, a psychological threshold is constructed.
A resistance point can also be artificial, representing the point in which the central bank of a country starts to provide currency on the market in order to counter the devaluation of its currency.
The problem appears when a clear trend is set, encouraged by short-term traders and maintained by long-term ones.
Types of Volatility
Based on the time frame, there are three types of volatility in the Forex market – hourly, day-of-the-week and long-term.
Hourly volatility is relevant to short-term traders. A currency pair is usually most volatile, outside of major external events, when the markets that are associated with each currency are open at the same time.
For example, EUR/USD, usually a relatively stable pair, is most volatile when the London and New York markets are both open for business.
In turn, day traders discover that each pair has different tendencies in each day of the week. The difference in volatility is the most visible tendency.
While hourly and day traders abandon their positions at the end of the day, therefore not encouraging lasting trends, long-term traders hold on for longer.
They use charts that show daily moving averages but which span for years. By doing so, they can establish when a pair is near yearly or multi-year highs or lows and can trade accordingly.
A trader that follows the evolution of the British pound, for example, will no doubt notice its 31-year low as a result of the Brexit vote and the subsequent uncertainty.
Through the past behavior of the market, they predict its future reactions. This is the easiest way of trying to make predictions regarding the volatility of the Forex market.
Attempt at Prediction
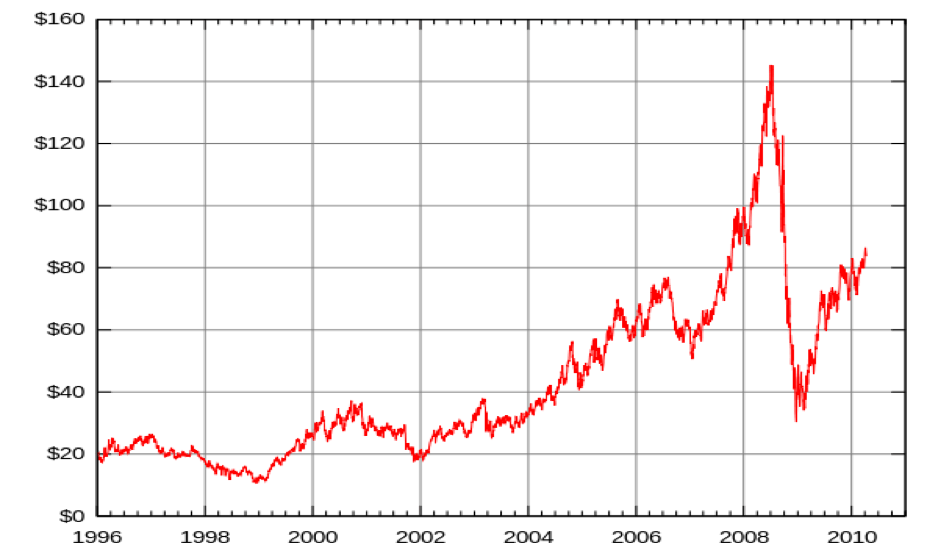
There are multiple ways in which to measure and predict volatility. Following moving averages for a longer period is the simplest method, as any major change in prices is immediately noticeable.
Analytical tools and complex indicators are also used for the same purpose. Bollinger bands, for example, are an indicator of volatility.
Two simple lines with incorporated standard deviations above and below a moving average and set for a definite period, Bollinger bands can contract – volatility is low, or wide – volatility is high.
Another tool is the Average True Range. Designed specifically to measure volatility, the ATR takes into account the high and low of the current period less the previous period’s closing value.
It can be used as a volatility filter, identifying environments with low or high levels of volatility and thus helping traders open new positions.
Conclusion
By definition, volatility is always present in a free market. One can never fully protect himself against it, nor should he be able to. Volatility is not, however, unpredictable.
Various methods, tools, and even experience can let one know when the market is going to push back. Keeping that in mind is paramount to operating on the Forex market.
Do you trade overseas in different currencies?
